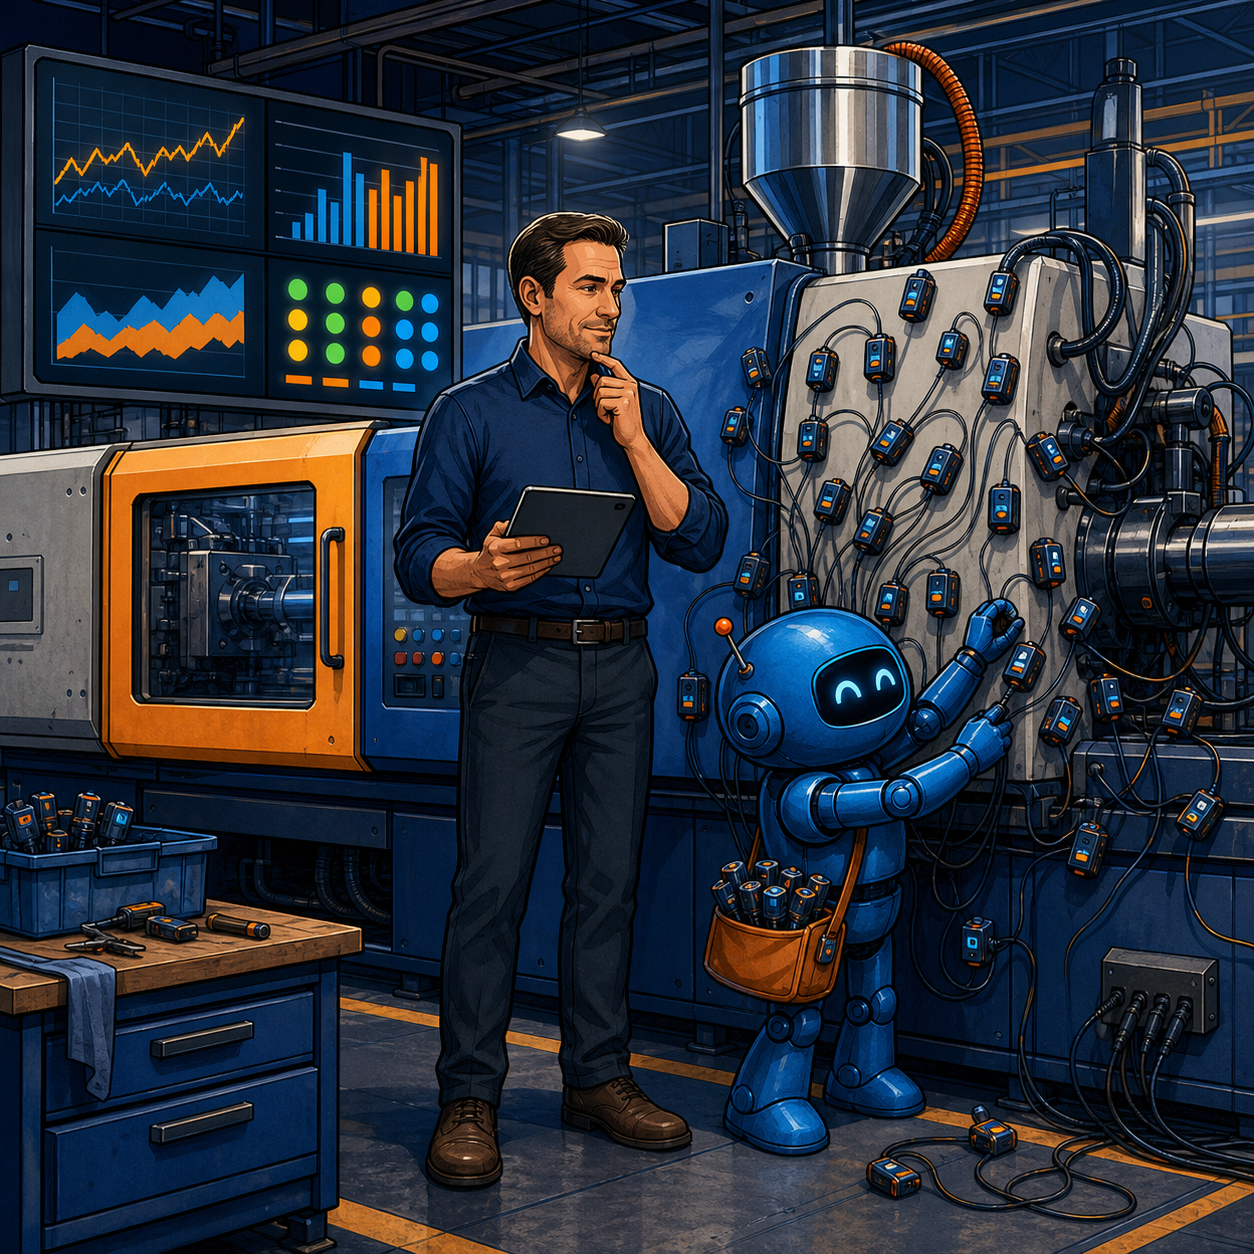
An eight-hour delay obscured cost and wear
Total Plastic Solution (TPS) is an Irish small enterprise with 10–49 employees and €2.6 million in turnover. It manufactures precision injection-moulded components on 28 machines. The company had developed its own ERP system over many years, but production indicators reached it at least one eight-hour shift after the fact.
Management therefore lacked a live view of utilization, energy cost during start-up and changeover, actual energy per part, and approaching service intervals. Job prices could not be linked precisely to machine time and electricity use. Faults were found late, while product carbon data required separate work.
TPS, the IDEAM institute, and FactoryXChange built a condition-based monitoring system. The project received two European grants, €10,000 and €90,000. This matters when interpreting the outcome: it was a staged engineering effort with an external research partner and funding, not a low-cost appliance connected in one evening.
The official European Digital Innovation Hubs Network case was published on 23 September 2024. Its claims come from project participants rather than an independent operational audit. The architecture and measurements still offer a useful pattern for small manufacturers: collect reliable edge signals first, establish thresholds second, and introduce machine learning only after those foundations exist.
The data environment
Edge acquisition devices were installed on the machines. They capture electrical parameters from three-phase equipment and component states, then deliver normalized events to the monitoring environment. The pipeline calculates:
- machine status and running time;
- energy consumption;
- number of parts produced;
- cycle time, efficiency, and OEE in real time;
- direct energy cost and estimated CO2 per part;
- tool utilization and approaching service intervals.
A dashboard displays current modes and production KPIs. The system sends email notifications when thresholds are crossed. Historical data from several machines supported statistical and machine-learning analysis to identify normal ranges and trends for individual components.
The essential point is that ML did not replace measurement or process rules. Engineers first defined a cycle, idle time, start-up, normal power, and a service interval. Without these definitions, a model could detect changes in an unlabeled stream but could not tell a shift what action to take.
What changed on the factory floor
The system identified a loose electrical contactor connection. Burn marks suggested that the problem had existed for some time; intermittent power could eventually have damaged motor windings and stopped production. Early detection allowed the component to be replaced before failure. Injection moulding makes this particularly valuable: after an emergency stop, material must be cleared before repair, so a failure creates downtime and waste as well as a component bill.
Tool utilization was integrated with ERP so that preventive-maintenance tasks could be created in advance. Morning start-up energy became manageable: heating had previously been switched on hours before actual production. Live readings also helped find incorrect settings. At one external factory, excessive mould-clamping force was associated with quality defects and unnecessary energy use; correcting it removed the quality issue and reduced tool stress.
By May 2024, TPS had commercialized the solution and installed it at three other factories. This is a participant statement, not evidence of broad deployment. The more transferable lesson is that an internal project became a service only after demonstrating value on the company's own process and accumulating interpretable data.
Reading the numbers carefully
The source describes a three-day run of roughly 50,000 parts at a cycle time of about 20 seconds on two hydraulic machines. Its table reports 2.20 kWh per hour and €0.54 in direct hourly electricity cost for one machine, versus 11.67 kWh and €2.88 for the other. That is a difference of approximately 5.3 times in hourly consumption and energy cost.
A sentence below the table swaps the machines and states the reverse cost relationship. It is therefore safer to rely on the table values rather than that inconsistent sentence. TPS's broader observation that an older hydraulic machine used five times more energy than a newer all-electric one should also be tested on each company's own products, modes, tariffs, and equipment condition.
“Five times” does not mean every older machine should be replaced immediately. A decision needs:
- time under load versus warm-up;
- good parts per hour;
- scrap and waste after stoppages;
- changeover and maintenance cost;
- remaining equipment life;
- the cost of capital and replacement machinery;
- time-of-use tariffs and peak power.
The appropriate metrics are total variable cost per good part and cost per available production hour. Management can then decide whether to move a batch, change start-up policy, repair a component, or plan asset replacement.
A minimum architecture for a small plant
A practical implementation separates five layers.
**1. Signal.** Energy meters, discrete machine states, controller data, cycle counters, and vibration or temperature sensors where they are genuinely related to failure. Connections must respect warranties, industrial safety, and PLC logic.
**2. Edge gateway.** It collects data close to the machine, applies accurate timestamps, buffers during network loss, and translates protocols into one model. Control commands remain separate from analytics: a failed dashboard must not stop production.
**3. Storage and context.** Telemetry is associated with the job, product, mould, material, shift, and downtime reason. Without context, the same power spike could mean normal warm-up, a new recipe, or a fault.
**4. Rules and analytics.** Begin with process thresholds and simple trends. Add ML for components with a repeatable signal, a history of normal operation, and confirmed maintenance events. An alert should include a reason, time window, and recommended check.
**5. Workflow.** An alert creates a task in maintenance or ERP, while a person confirms diagnosis, action, and completed repair. Technician feedback returns to the dataset. Otherwise the system accumulates alerts and the plant accumulates alarm fatigue.
Local deployment is often natural: telemetry volume is high, latency matters, and machines should not depend on an external connection. Aggregates may go to cloud reporting or training when data policy allows. A large language model is unnecessary for baseline monitoring; it may later explain reports or retrieve manuals, but it does not replace deterministic equipment protection.
Risks to close before a pilot
Connecting a factory floor expands the attack surface. The analytics gateway should sit in a separate segment, have only necessary outbound connections, and lack permission to modify machine programs. Updates should be signed, user accounts personal, events logged, and the manual fallback tested.
False alarms are the second risk. If a threshold fires every shift, operators stop responding. Each signal needs an owner, a severity class, a response time, and a weekly review of false positives. Ten reliable warnings are more useful than one hundred attractive charts.
The third risk is false causality. A current change and a defect occurring together do not prove that current caused the defect. A process engineer must confirm the mechanism, and a controlled run should show repeatability. Repair and quality decisions remain with accountable staff.
Modelled pilot economics
Assume a company has eight machines, one critical machine costs RUB 18,000 per downtime hour, and monitoring prevents one four-hour failure each quarter. The modelled benefit is RUB 288,000 per quarter. If start-up optimization saves another RUB 35,000 each month, the combined quarterly effect reaches RUB 393,000 before costs.
Subtract sensors and installation, gateways, integration, calibration, support, network security, and process-engineer time. These figures do not describe TPS; they illustrate the calculation. A pilot pays back through confirmed avoided downtime, lower energy per good part, and less scrap—not through sensor count.
Next step: six weeks on one bottleneck
Select one machine where downtime or energy affects margin and define one measurable hypothesis.
- **Week 1:** establish a baseline for output, scrap, downtime, energy, warm-up, and service events.
- **Weeks 2–3:** connect read-only collection, validate timestamps and completeness, and agree on operating-state definitions.
- **Week 4:** configure two or three process thresholds and a manual confirmation log.
- **Week 5:** run alerts in shadow mode and measure false positives.
- **Week 6:** compare energy per good part, detection time, and avoided downtime with the baseline.
Add machine learning only when simple rules leave a repeatable problem and confirmed examples exist. The TPS case demonstrates a sound sequence: ERP does not become intelligent because another dashboard appears. It becomes more useful when it receives a live signal and each warning connects to an accountable action and economic outcome.