Measure first, “predict” later
Ireland's Total Plastic Solution (TPS) is a small manufacturer of injection-moulded plastic components. The European Digital Innovation Hubs Network describes it as a company with 10–49 staff and 28 injection-moulding machines. TPS already had its own ERP system, but production indicators arrived at least one shift—about eight hours—late. That made it difficult to spot component wear in time, price changeovers or calculate energy use per part accurately.
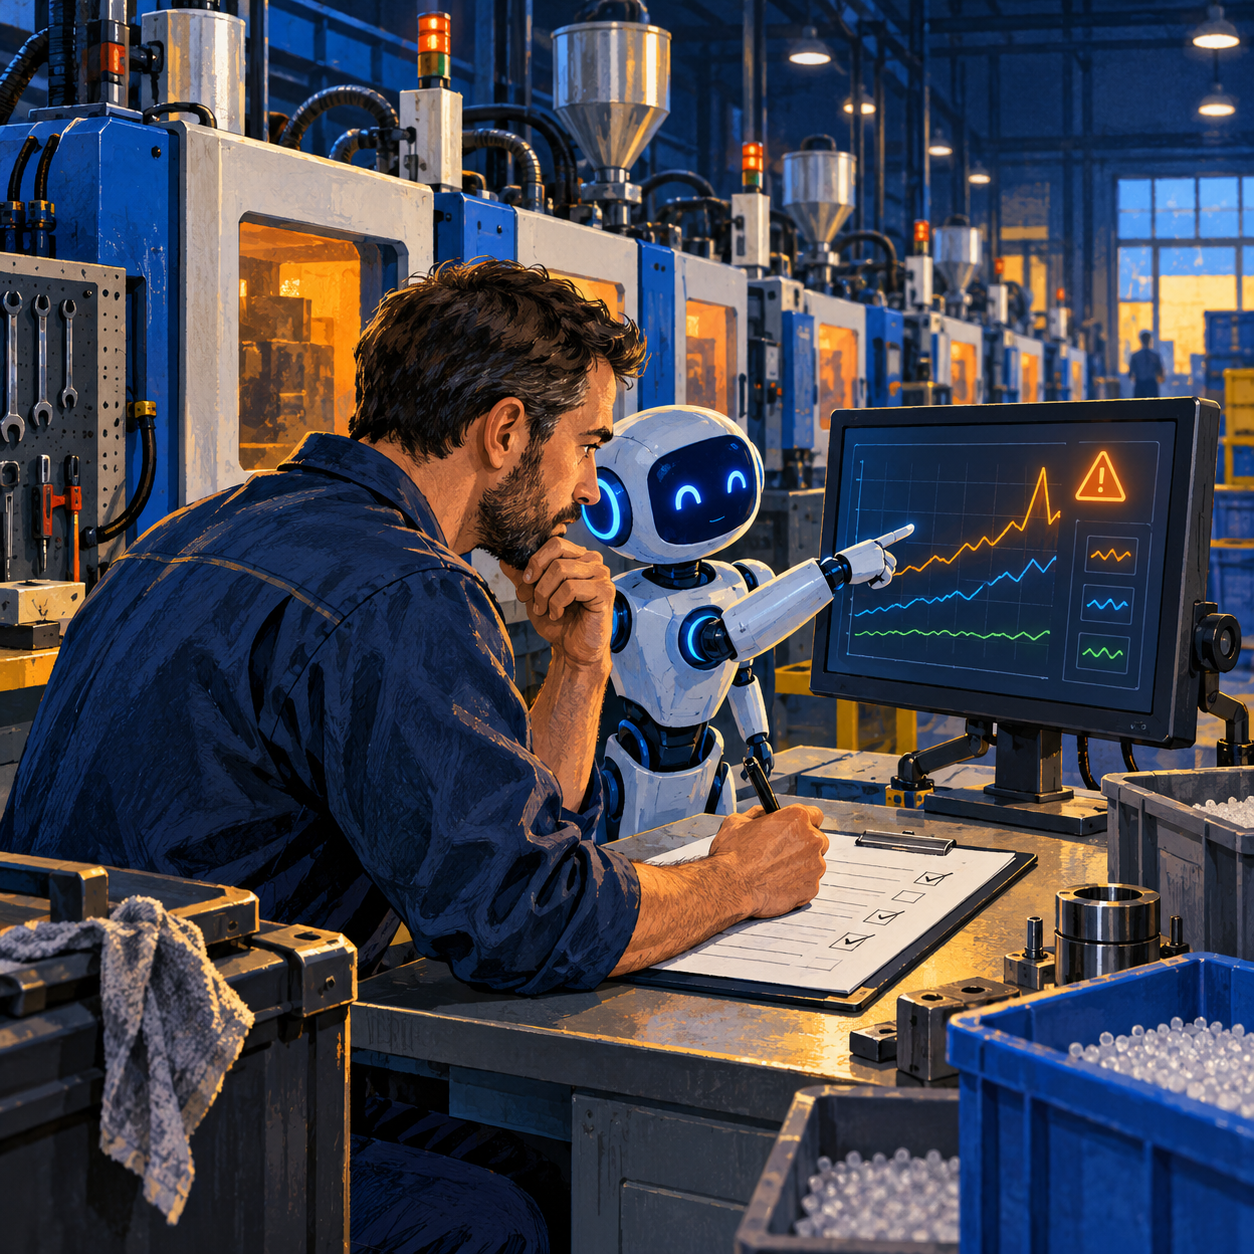
Together with the IDEAM research institute, TPS installed edge data-acquisition devices on its equipment. They capture machine status, electricity use, output count, cycle times and tool-service intervals. Accumulated readings are analysed with statistics and machine learning; a dashboard shows production indicators and alerts staff when parameters cross thresholds. Preventive maintenance notifications also feed into the ERP system.
The system should not be credited with more than the case demonstrates. The account does not disclose the ML model, prediction accuracy, false-alarm count or savings attributable specifically to the algorithm. What it describes is a combination of measurements, thresholds, analysis and engineer action. For a smaller factory, that is more useful than a story about AI that “predicted every breakdown.”
What changed on the shop floor
The case provides one concrete incident: monitoring helped identify a loose connection at an electrical contactor. Burn marks indicated that the problem had persisted; if left unresolved, it could have damaged a motor and stopped production. This is an observation, not a measured count of accidents avoided. Inspection and repair decisions necessarily remain with a qualified specialist.
The system also connected electricity consumption to part output and machine settings. TPS used those figures to plan production, start heaters when needed and estimate energy cost per part. In a separate example at another manufacturer, the data helped uncover excessive mould-clamping force associated with defective products. The EDIH account says TPS's solution had been installed at three other factories since May 2024. These are project-reported facts, not an independent audit of the benefits at every site.
There is an important inconsistency in the source: its comparison table shows a higher electricity cost for machine T10, while the following sentence says the opposite. That paragraph should therefore not be used as a ready-made payback calculation. In your own pilot, keep original meter readings, counts of good parts and the cost-allocation method; reconcile tables before making a management decision.
Where local AI fits—and where ordinary automation is enough
This task naturally starts on the factory network. The machine or sensor sends telemetry to an edge collector, which adds a timestamp and machine identifier, filters obvious measurement failures and stores readings in a local time-series system. Threshold rules can flag current, energy per cycle or heating time outside an agreed range. An anomaly model is needed only when simple thresholds create too many false alarms or miss combinations of weaker signals.
A small equipment fleet does not necessarily need a large language model. First check sensor calibration, reliable timestamps and accurate production events. Statistical rules and a simple model on a local server are often more useful than an expensive generative stack. Later an LLM may help explain a confirmed anomaly using manufacturer manuals—RAG over versioned manuals and service logs can serve that purpose. But an LLM should not change machine setpoints on its own or replace an electrician's judgment.
An ERP integration should create an inspection task linked to the machine, shift, parameter trend and responsible person, rather than an opaque message such as “87% failure probability.” Record whether the maintenance lead confirmed the fault, what action was taken and how much downtime occurred. Those feedback labels enable thresholds and models to be reassessed.
A NIST research review notes that monitoring systems can miss failures or create false alarms and require maintenance themselves. Its authors also find that economic results are difficult to compare across studies because methods and metrics vary. The review does not promise a specific percentage of avoided stoppages for TPS or any other plant.
Data and limits that matter
Start with one machine type and one expensive failure scenario. You will need shutdown and repair histories, counts of acceptable parts, electrical readings at a known sampling rate, operating modes and a maintenance calendar. If repair logs are free text, agree on cause categories with mechanics and electricians in advance. Otherwise the model may produce attractive charts without trustworthy ground truth.
Compare machines only under similar products, materials and operating conditions. Higher consumption may indicate a new order, warm-up, different tooling or tariff changes rather than a fault. A threshold tuned to one press must not be copied to another without validation. Sensor-quality checks, data backup, versioned rules and a manual fallback when communications fail are necessary.
Cybersecurity is especially important where the production network meets analytics. Initially keep the OT-to-analytics flow mostly one-way and give AI no write access to controllers. Use role-based access for signals and repair logs. TPS also describes automated heater control, but copying that feature without an engineering assessment of protective systems and existing interlocks would be unsafe.
Economics without invented benefits
The pilot's metric is not the number of alerts but the value of avoided downtime and decision quality. Record the cost of an hour's stoppage for the selected machine, typical repair cost, material losses and staff time spent investigating a false alert. Then measure the share of confirmed alerts, time from anomaly to inspection and any change in unplanned downtime across comparable shifts.
Illustrative calculation, not a TPS result: if one confirmed signal prevents four hours of downtime at ₽20,000 an hour, the potential value is ₽80,000. But 20 false alerts a month, each requiring an hour of inspection, must be charged against that figure, along with sensors, integration and ongoing maintenance. Until it is clear whether a shutdown would actually have happened, the estimate cannot be booked as realized profit.
Do not begin by buying AI servers. Begin with sensors and a reliable event log. Collect data for the first weeks without automatic action, then enable transparent rule-based alerts. Only if measurements show a material gap should you test a local model against that baseline. Rare failures may require a long observation period, not a supposedly successful two-week pilot.
A concrete next step for management
Bring together a production lead, electrician and IT owner. Choose one line, one costly stoppage mode and three measurable signals. Specify who confirms an alert, who creates the ERP work order and who is allowed to change machine settings. After a month, assess data quality and the cost of investigating alerts; only then decide whether an anomaly model is justified.
The TPS lesson is not that every factory needs sophisticated AI. It is that local measurements, timely diagnosis and a clear path from signal to accountable action can deliver more value than a report that arrives after the shift.