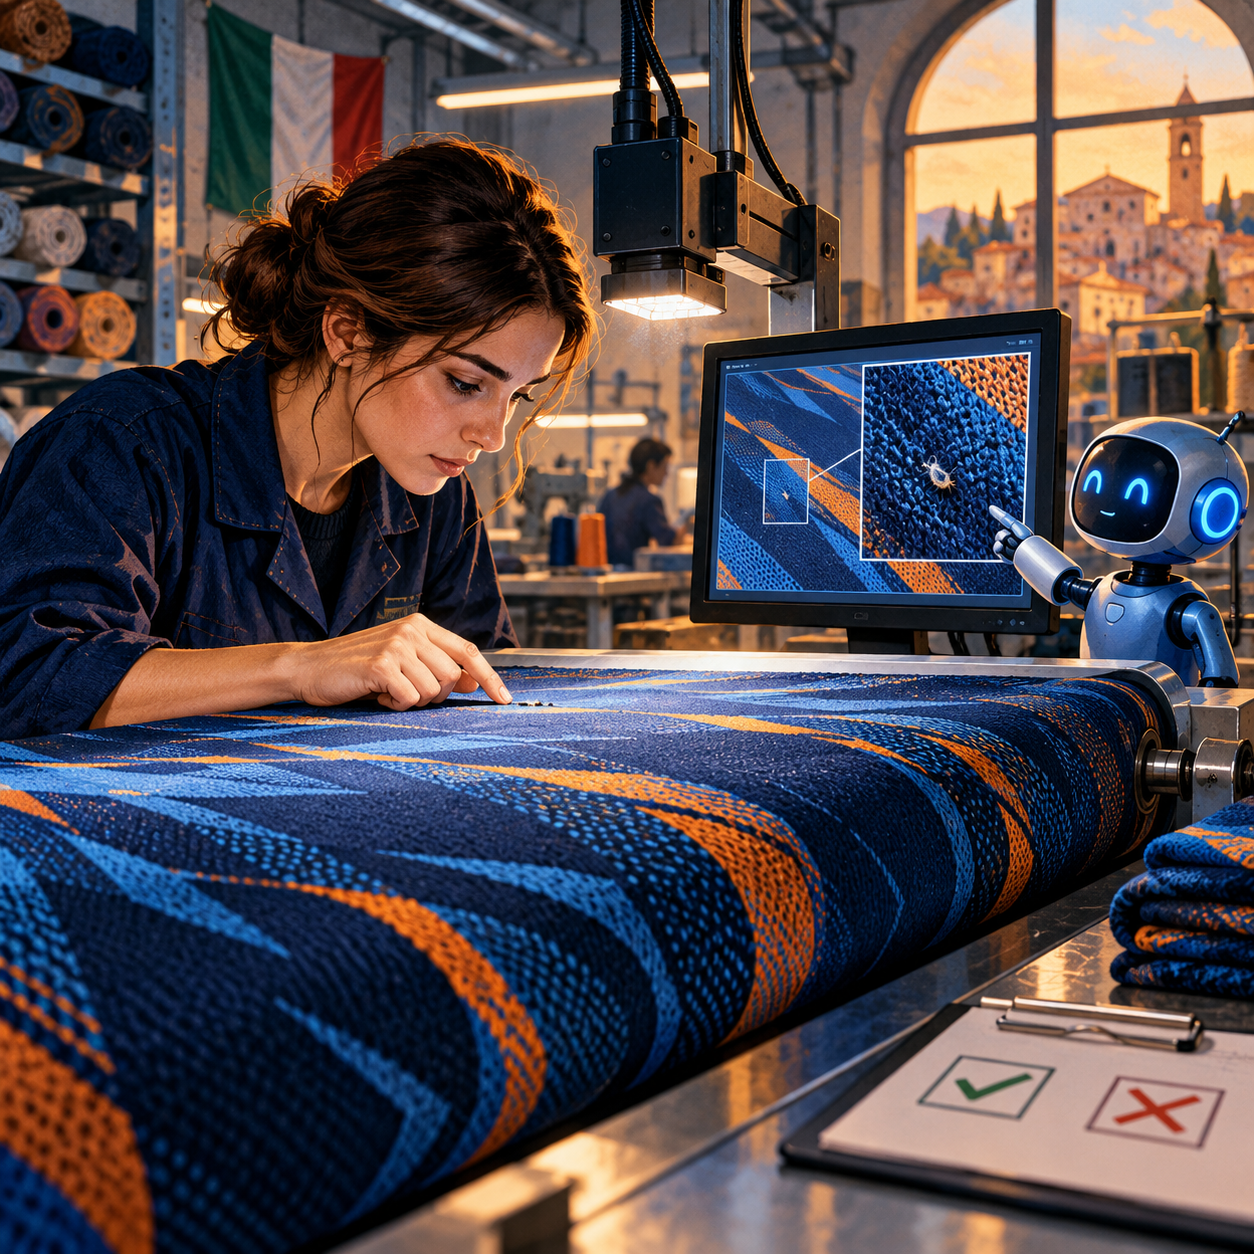
Fabric first, model second
For a small textile mill, a defect in a roll is not an abstract classifier error. It can mean wasted material, a late discovery of scrap and more staff time spent rechecking the cloth. Italy's Staff Jersey manufactures knitted and jacquard fabrics. Together with the ER2Digit digital innovation hub and technology partner Centro Qualità Tessile, the company tested computer vision for visual anomaly detection. The European Digital Innovation Hubs Network published the pilot description in October 2025. This is an analysis of an existing project, not a claim that a new model has just launched.
The most useful lesson is surprisingly physical: before arguing about neural networks, keep lighting, viewpoint, scale and the reference sample of “normal” fabric consistent. In the case, the camera was first positioned farther from the cloth, then brought to roughly 15 cm and its illumination aligned with the surface to reduce shadows. Mounting it to a fixed machine component helped avoid rotation artifacts. If the image changes with the lamp or the machine, the model may dutifully detect “anomalies” in the lighting.
How the experiment worked
According to the published account, trial acquisition used a GoPro HERO13 Black with a macro lens. It captured images every five seconds. Small patches were extracted from images of known-good fabric. Software added synthetic defects of varying shapes, colors and textures to some patches; because the insertion location was known, a training mask could be generated automatically. Real defects were also studied to bring the synthetic examples closer to production conditions.
The second part of the approach compares material with a reference for the particular fabric. When the fabric changes, an operator confirms that the first segment is acceptable; the system uses it as a fresh baseline. This is more credible than claiming that one model will recognize every kind of defect: patterns, colors and textures vary between batches. The algorithm produces a map of suspicious regions, while a person decides whether an area is acceptable under the customer's requirements.
The source describes a prototype and an assessment of possible integration into a pilot production line. It should not be presented as proven around-the-clock operation across all Staff Jersey machines. With an image every five seconds, the fabric speed and the camera's field of view must be checked separately to establish surface coverage. The publication provides neither travel speed nor the proportion of the surface inspected, so coverage cannot be inferred from capture frequency alone.
What the attractive 99.93% means
For evaluation, developers assembled 200 crops of 256×256 pixels from images not used in training: 100 with a real defect and 100 without one. They report AUROC and AUPRC of 99.93% each, and 99.5% classification accuracy at a 0.5 threshold. These numbers show that the chosen test set was well separated by the anomaly score. They do not mean that the system will find 99.93% of defects on every roll.
The limitations are concrete. Half the crops in the test were defective by design; the defective share on a functioning line may be much lower. At a different prevalence, false alarms and practical precision behave differently. The source does not break results down by batch, lighting shift, fabric type or the size of the smallest defects. It also does not publish a confusion matrix for the operating threshold. Accuracy of 99.5% on 200 crops means one error in this test; without the error type, we cannot tell whether a defect was missed or good material was held up.
Independent research by the MVTec team on the AD 2 dataset highlights the transfer problem: lighting changes, high variability in normal texture and tiny defects make real inspection scenarios harder than familiar benchmarks. That paper does not evaluate the Staff Jersey system. It is a reason to test the solution under new production conditions instead of copying a laboratory score into a quality agreement.
An architecture for a small workshop
A production pilot does not need a giant platform. First, an engineer and a quality controller define the area that must be visible, the smallest unacceptable defect and what happens after an alert. Then they select the camera, lens, lighting and stable mount. Every captured image should be stored with a timestamp, batch identifier, model version and decision threshold. Without that trail, a disputed decision cannot be reconstructed.
A local service receives the frame, compares it with the confirmed baseline for that fabric, creates an anomaly map and proposes coordinates for inspection. The operator sees the original frame and marked area, confirms a defect or rejects a false alert. Only verified events move to a manufacturing execution or accounting system. Stopping the machine automatically is a separate, much riskier phase; it must not be enabled on the strength of an attractive test AUROC.
A local model is suitable here: production images and customer parameters remain inside the factory, processing latency is predictable and external connectivity is not part of the quality-control chain. But local deployment does not cure poor lighting or remove the operator. RAG and language agents are not needed to detect a pixel-level defect. They might later retrieve approved process instructions or draft a checked report, but that is a different workflow.
Economics without fictional ROI
The sources describe earlier detection and less repetitive manual inspection, but do not publish total cost of ownership or verified monetary returns. For your own mill, track inspection hours; meters of fabric lost because defects were discovered late; the cost of false stops; annotation effort; and camera, lighting, compute and support expenses.
Here is an illustrative calculation, not a Staff Jersey result. Suppose a line loses 20 meters of cloth each month through late defect detection, each meter costs RUB 400, and the pilot prevents half those losses. Potential material savings would be RUB 48,000 a year: 20 × 400 × 12 × 50%. Errors, maintenance and equipment must still be deducted. If actual losses are lower, the project may not pay back. Establish the baseline defect rate and the cost of each failure category before purchasing a system.
Next step: a pilot on real batches
Select one machine and one fabric type. Collect images of acceptable material and real defects across several shifts, including changes in lighting and machine settings. Split training and validation by batch rather than randomly assigning adjacent crops from the same image. On a held-out set the developer has not used, measure not only AUROC but missed critical defects per roll, false alerts per shift, operator time and the share of the surface actually captured.
For the first weeks, keep the system advisory: a person decides, and the event log helps identify failure causes. Consider automatic actions only after stable results across different batches. The Staff Jersey case demonstrates the value of synthetic examples and a changing reference sample, but a commercial decision starts with lighting, data and the cost of errors—not a percentage on one test.