What happened at Rohleder
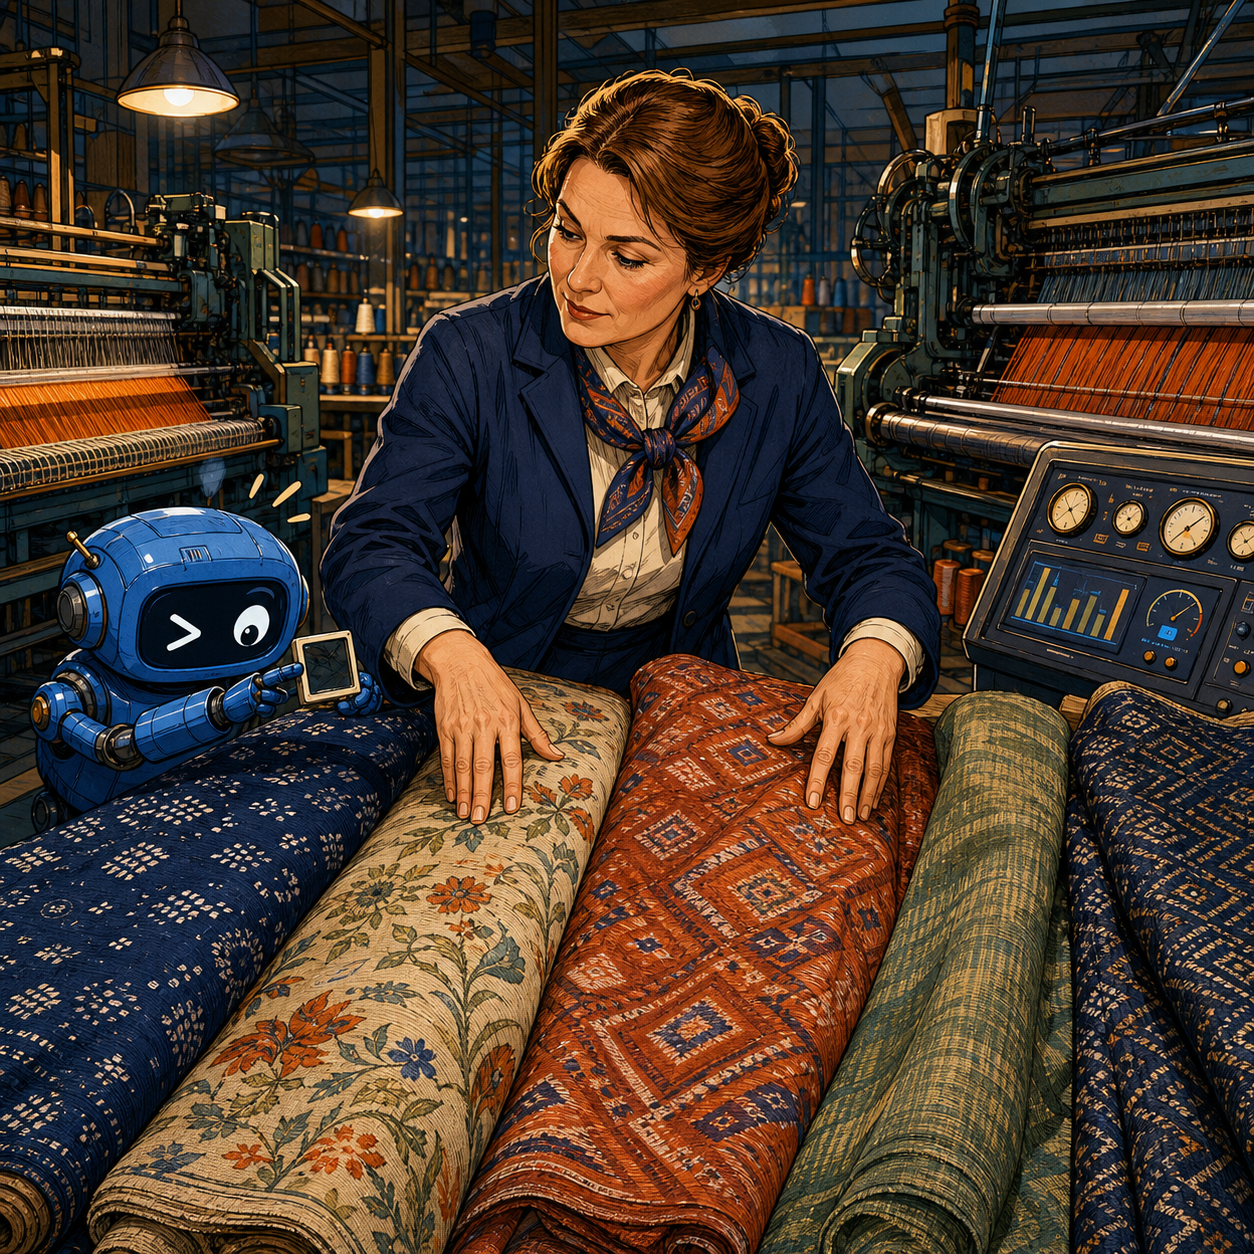
Rohleder is a German family-owned company producing made-to-order interior textiles in small batches. According to the OECD, it employs about 170 people, while product variety and frequent design changes make its operation substantially more complex than a mass-production weaving line.
The company followed a staged path. It first moved invoicing from paper to a digital workflow, then worked with university partners to collect and analyse machine data. The OECD links these projects to a 20% increase in weaving productivity and fewer machine stoppages.
Rohleder separately invested EUR 1 million in a new warping machine. Warp preparation fell from approximately one hour to twenty minutes. That result came from specialised equipment and process redesign, not generative AI.
The company also evaluated machine vision for automatic fabric inspection and decided not to deploy it. Available solutions could recognise recurring defects in stable mass production, but were a weaker fit for Rohleder’s small batches, different patterns and materials, and frequent changeovers.
That is the value of the case: the manufacturer achieved measurable gains from data and automation while refusing to attach an AI label to a task that did not yet pass quality and economic gates.
Why machine data worked before AI
Analysing productivity does not require a model to understand whether a textile is attractive. A machine already produces events that can be linked to a job and time:
- start and completion of an operation;
- actual and planned speed;
- duration and reason for a stop;
- product, batch, material, and setup recipe;
- output and scrap;
- changeover time;
- shift and confirmed operator action.
When these fields are collected consistently, a manager sees more than a monthly average. The data reveals which type of order causes downtime, where changeovers expand, and after which event speed declines.
The first benefit usually comes from transparent analytics rather than a complex neural network: one reason dictionary, signal completeness checks, shift comparisons, and simple deviation alerts. A model becomes useful later, for example when combinations of factors are too difficult to express as rules.
Why visual inspection was harder
Computer vision requires a stable task definition. Each defect needs images, consistent labels, and an agreed decision about whether a feature is a defect, an acceptable variation, or part of the design.
In mass production, a camera observes the same material under the same lighting thousands of times. In made-to-order manufacturing, the background keeps changing: colour, weave, yarn thickness, gloss, texture, and acceptable pattern variation. A model may classify a new design as an anomaly or miss a rare defect.
A recent European Digital Innovation Hub case involving 24 Vision shows that an inspection project first had to select spectrum, lighting geometry, camera position, and filters and then build a representative dataset. This qualifies the promise to “install a camera and add AI”: image quality and the defect taxonomy are part of the product.
Rohleder’s decision does not mean machine vision is useless in textiles. It means readiness depends on process repeatability, defect frequency, the cost of a miss, and data volume for each product variant.
How another manufacturer can apply the approach
A practical digitalisation programme begins with three gates.
Gate 1: Is the process observable?
Before selecting a model, the company needs a source of facts. For older equipment, that may be an industrial gateway, controller signals, a current sensor, or a manual downtime form. The key is not the number of tags but the link between an event, job, machine, and timestamp.
Gate 2: Can a rule improve it?
If downtime is caused by missing material, overdue maintenance, or a long changeover, start with planning, a procedure, and an alert. Prediction does not replace missing ownership.
Gate 3: Does AI add a decision?
A model is appropriate when data is sufficient, rules become too complex, and the output can be verified. Examples include failure prediction, classification of rare causes from logs, defect detection on a stable series, or an operator assistant grounded in approved instructions.
This order protects the budget. A company can stop after analytics if it already removes the main loss, or prepare data for the next stage without an expensive blind experiment.
Minimum architecture
A pilot does not require replacement of the entire control system. An isolated five-component path is sufficient.
1. A gateway reads permitted equipment signals without permission to control the machine.
2. A time-series store records events with job and batch identifiers.
3. A reference-data layer normalises stop reasons, products, materials, and operating modes.
4. A dashboard presents output, downtime, changeovers, and quality by shift.
5. An analysis layer runs rules or a model and routes a recommendation to a person.
Machine vision adds a camera, fixed lighting, frame storage, and a labelling interface. The source image, model version, confidence threshold, and inspector decision should be stored together. Without that chain, a disputed error cannot be investigated or used to improve the model.
A local model is appropriate when images contain commercially sensitive designs, low latency is required, or the line cannot depend on an external connection. Local inference does not remove the cost of cameras, GPUs, labelling, drift monitoring, and revalidation after a material change.
Production security
The most dangerous mistake is to grant an experimental agent direct write access to a controller or recipe system. A pilot should receive data through a one-way or tightly restricted interface and produce recommendations only.
Minimum controls include:
- segmentation between production and office networks;
- a dedicated identity for the data collector;
- read access only to required signals;
- a queue and buffer for connection failures;
- an audit log for reference-data and label changes;
- a manual fallback process;
- technologist approval before an operating-mode change;
- no external API transfer of product images without a separate decision.
If an AI agent is introduced later, its tools should also be separated: reading metrics, drafting a work order, and changing equipment are different permission levels.
A model calculation for a pilot
Assume a workshop operates ten machines. Analytics and removal of one recurring cause reduce downtime by thirty minutes per machine per working day. Across 22 days, this represents 110 machine-hours per month.
If one machine-hour contributes RUB 4,000 toward fixed costs and profit, the gross resource effect is RUB 440,000. Assume data collection, infrastructure, and support cost RUB 100,000 per month and implementation costs RUB 1.5 million. The modeled net effect is RUB 340,000 per month, and simple payback is approximately 4.4 months.
This is an illustration, not Rohleder’s economics. The calculation should use the marginal effect of the actual line rather than product revenue. If released capacity cannot produce additional output or reduce overtime, the financial benefit will be lower.
For computer vision, the cost of missed defects, false rejection, and human review must be calculated separately. High accuracy on a test set does not by itself prove return on investment.
A six-week pilot
Week 1: select one line and establish the baseline for output, downtime, changeovers, defects, and manual reporting time.
Week 2: connect signals in read-only mode and compare them with the operator log.
Week 3: introduce one reason dictionary and achieve acceptable data completeness. A missing reason should become a visible exception.
Week 4: identify one recurring loss and change the process without AI: an alert, maintenance action, material preparation, or changeover sequence.
Week 5: compare the result with the baseline and a neighbouring area. Only then assess whether a remaining problem offers additional value for a model.
Week 6: decide whether to scale analytics, collect a dataset for an AI pilot, or stop. A justified rejection is a research result, not a failure.
What managers should take away
The Rohleder case demonstrates a mature sequence: observe the process, automate an understood loss, and only then test AI. Machine data produced a measurable result, while visual inspection was postponed because diverse small batches did not match the ready-made solution.
For a manufacturing SME, the best first project is not “AI across the factory” but one line, one event dictionary, and one verifiable metric. Sometimes the best answer will be a model. Sometimes it will be a sensor, a procedure, or a new machine. Management value lies in distinguishing them before purchasing.