What happened
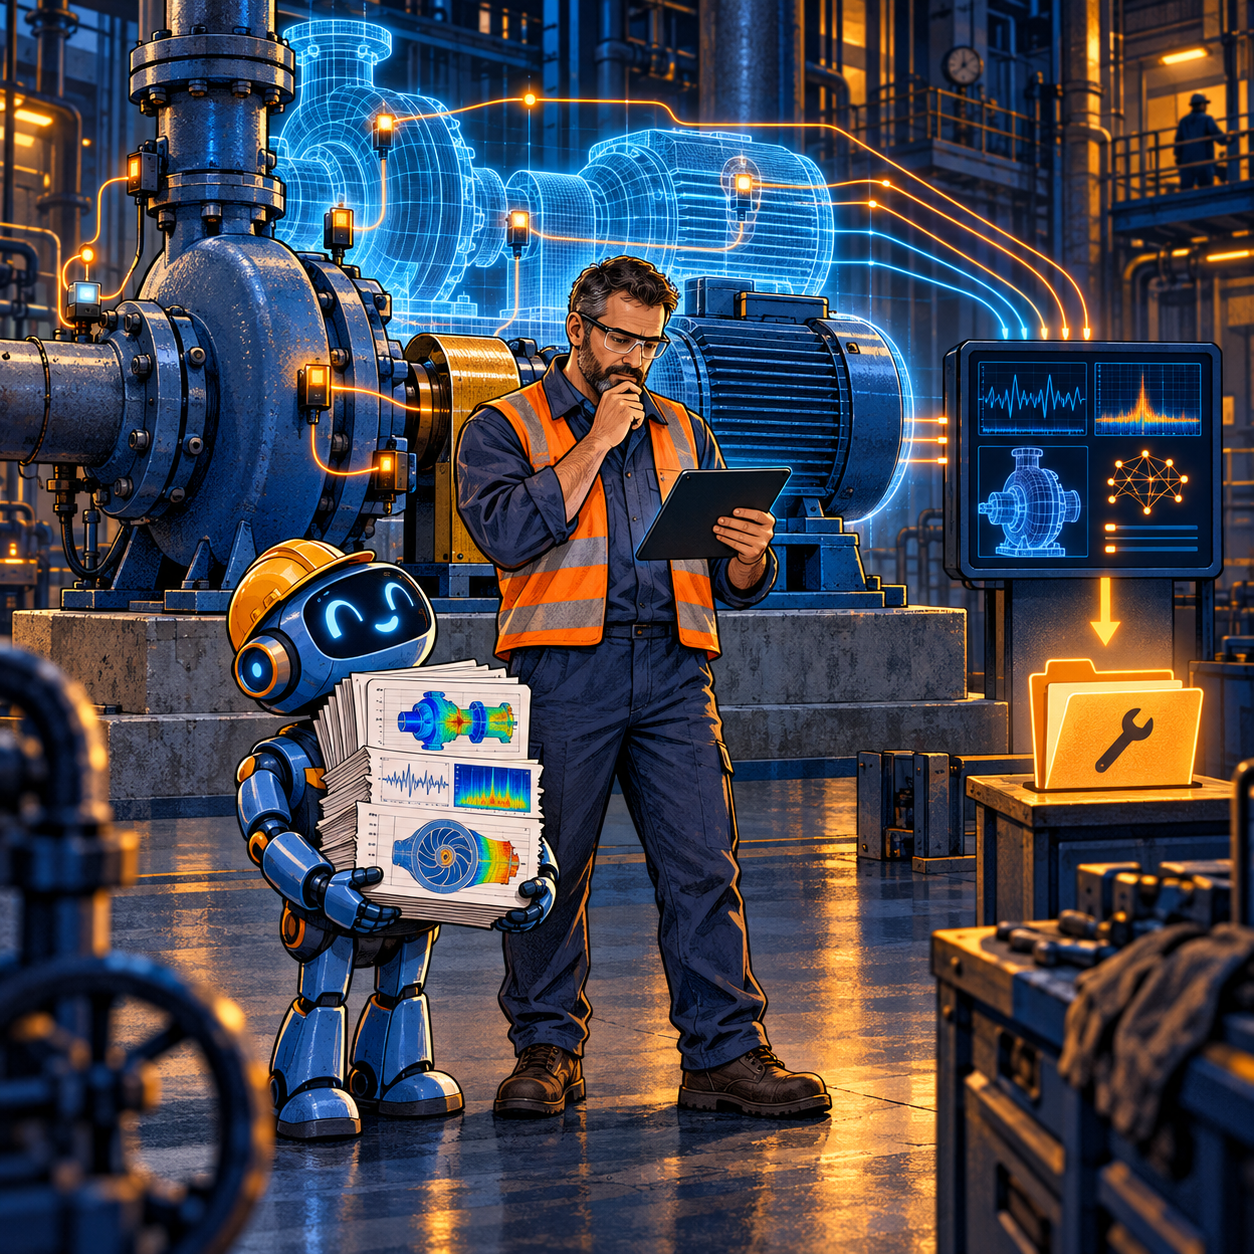
Greek software company Nessos and the MGroup research team at the National Technical University of Athens developed mAIntAIn, a platform for monitoring and maintaining industrial equipment. In the FFplus case study, the system combines telemetry, physics-based computation, digital twins and machine learning so that engineers receive more than a generic anomaly alert: they receive an explainable risk assessment and a proposed next step.
The project focuses on maritime machinery, but the pattern also applies to pumps, compressors and other expensive assets.
FFplus reports that the solution was validated with two maritime companies. The programme reports an approximately 20–30% reduction in technical triage time and a 5–10x acceleration of simulation and calibration cycles compared with workstations. These figures belong to this specific project. They should not be promised to a new plant before testing the approach on its equipment, sensors and maintenance workflow.
Why an anomaly model is not enough
Actual failures are scarce: the model sees thousands of normal operating hours and only a few confirmed faults. Operating modes also change—a healthy pump at half load differs from the same pump during start-up. Engineers still need to understand the alert and choose a safe action.
A physics model connects load, temperature, vibration, pressure and materials with asset behaviour. ML accelerates expensive calculations and finds deviations. This is not a contest between formulas and neural networks, but a controlled combination:
- physics defines permissible behaviour and constraints;
- operational data calibrates the model for a specific asset;
- ML accelerates evaluation and ranks risks;
- an engineer decides and closes the action in the maintenance system.
A production-ready workflow
The mAIntAIn case uses a three-tier Azure platform and HPC batch analytics. Large finite-element simulation campaigns, sensitivity analysis and uncertainty analysis run outside the live operational path. Lighter models then support fleet-level analysis.
For a small or midsize industrial company, the architecture can be divided into six layers.
1. Asset identity and telemetry
The pipeline starts with an equipment identifier, not with AI. Every measurement must be linked to a specific asset, component, sensor, unit and timestamp. Operating context is also required: speed, load, input material, shift, ambient temperature, starts and stops.
Without this context, a normal operating-mode change easily becomes a false alert. Mixing telemetry from different equipment variants is particularly risky when the same signal name hides different ranges or sensor locations.
2. Maintenance context
Telemetry does not know that a bearing was replaced last week or that a sensor was recalibrated. Measurements therefore need links to the CMMS, ERP or maintenance log: work orders, replaced parts, confirmed cause, downtime and inspection result.
This layer turns a vibration chart into a business fact. If an alert cannot be reconciled with an inspection and a closed work order, the team cannot distinguish a useful signal from an attractive dashboard line.
3. Physics simulations and the digital twin
The selected asset class gets a computational model: stresses and deformation, thermal behaviour or damage propagation, for example. Parameters are evaluated across many operating scenarios, including boundary conditions. mAIntAIn uses finite-element analysis together with sensitivity and uncertainty analysis.
These campaigns can be too heavy for an ordinary engineering workstation. A company does not need to own a permanent supercomputer, however. Large simulation batches can run on external HPC or rented clusters, while live scoring remains inside the company's controlled environment.
4. A reduced model for operations
A full physics simulation may be too slow for every incoming telemetry window. Simulation outputs can therefore be used to build a reduced-order or surrogate model. It evaluates state much faster while retaining a connection to physical variables and a documented validity domain.
Version control must cover more than the ML weights. The computational configuration also matters: geometry, materials, boundary conditions, sensor ranges and the scenarios used for validation.
5. Risk scoring with evidence
The live service receives recent telemetry, validates its quality and calculates features. The output should contain more than an anomaly score and a traffic-light colour. It should include an evidence package:
- the asset and operating mode analysed;
- parameters that moved outside the expected range;
- the exact model version used;
- the estimated uncertainty;
- similar cases and maintenance records;
- the proposed action and its rationale.
When data is missing or the asset is operating outside the validated domain, the correct response is “diagnostic inspection required,” not a confident failure date.
6. Work order and engineer feedback
The alert must enter the existing process: a technical finding queue, CMMS work order, shift plan or shutdown approval. The engineer confirms or rejects the finding, records the actual cause and closes the action. This feedback becomes training and calibration material for the next model version.
An experimental model should not automatically stop safety-critical equipment. Decisions that affect safety, production and warranties remain with accountable specialists and the established protection systems.
Data requirements
The dataset should follow one failure mode, not an ambition to “predict everything.” Bearings may need vibration, temperature, speed, load, lubrication and inspections; a heat exchanger may need temperature, pressure, flow and cleaning history. Before a pilot, check:
- stable timestamps and asset identifiers across sources;
- sampling frequency and missing data;
- sensor calibration and replacement history;
- units and expected ranges;
- maintenance records with causes, not just dates;
- boundaries between normal operating modes;
- the ability to link an alert with an inspection result.
Free-text maintenance records should first be mapped to a fault and work taxonomy, or the same fault will receive conflicting labels.
Where computation should run
A company does not need to reproduce the exact Azure stack. A practical hybrid design is:
- telemetry collection and first-line validation on site;
- deterministic rules and lightweight scoring near the equipment;
- feature history and work-order data in a protected corporate environment;
- occasional simulation campaigns on rented clusters without direct production identifiers;
- controlled model return through an artifact registry and acceptance procedure.
Latency, data volume, connectivity, confidentiality and downtime cost should drive the choice.
Pilot economics
Predictive maintenance does not create value through model accuracy alone. Value comes from avoided downtime and better work planning. At least five quantities must be included:
- the cost of one hour of unplanned downtime;
- probability and impact of the selected failure mode;
- cost of a false alert, including inspection, travel and shutdown;
- sensor, integration and historical-labelling costs;
- the share of alerts that leave enough time for a useful intervention.
An initial model can use scenarios: a year without the system, a conservative case with a small number of avoided incidents, and a downside case with excessive false alerts. Every historical failure should not be counted as future benefit. The system must demonstrate sufficient lead time and lead to a confirmed action.
An 8–12 week pilot
The first pilot does not need a digital twin of the whole plant.
1. Select one class of expensive assets and one understandable damage mechanism.
2. Agree with engineers on the definition of a useful alert and minimum lead time.
3. Collect telemetry, operating modes and maintenance history; label source quality separately.
4. Build a simple baseline and physics-based limits. Add complex ML only where the baseline is insufficient.
5. Validate on a later time period so that future information cannot leak into training.
6. Run in shadow mode: the system produces findings but does not change the maintenance plan automatically.
7. Review false alerts, missed events and engineer decisions every week.
The key metrics are technical triage time, confirmed-alert rate, missed events, false alerts per asset per week, lead time and cost per confirmed useful action. Only then should the company scale the sensor fleet, models and compute resources.
Important limitations
A digital twin ages with the equipment. Wear, repairs, replacement parts and operating changes require recalibration. Sensors can drift as well, while the model confidently interprets sensor failure as an asset problem.
Results from one type of marine engine do not automatically transfer to another pump or compressor. Even nominally identical machines differ in installation, load and maintenance. Uncertainty must be visible to the user and incorporated into escalation rules.
Finally, new telemetry pipelines and remote computation expand the access surface. The design needs dedicated service identities, network segmentation, audit logs, controlled data export and verifiable model delivery. Predictive maintenance must not become a side door into the industrial environment.
Practical conclusion
A dependable system connects telemetry, maintenance history, a physics model, ML and the engineer's workflow. Heavy computation can run as batch HPC while live operations remain under company control.
Start with one expensive failure mode and shadow mode. An alert that cannot be explained, verified and converted into action is still an analytics demonstration—not yet a maintenance tool.