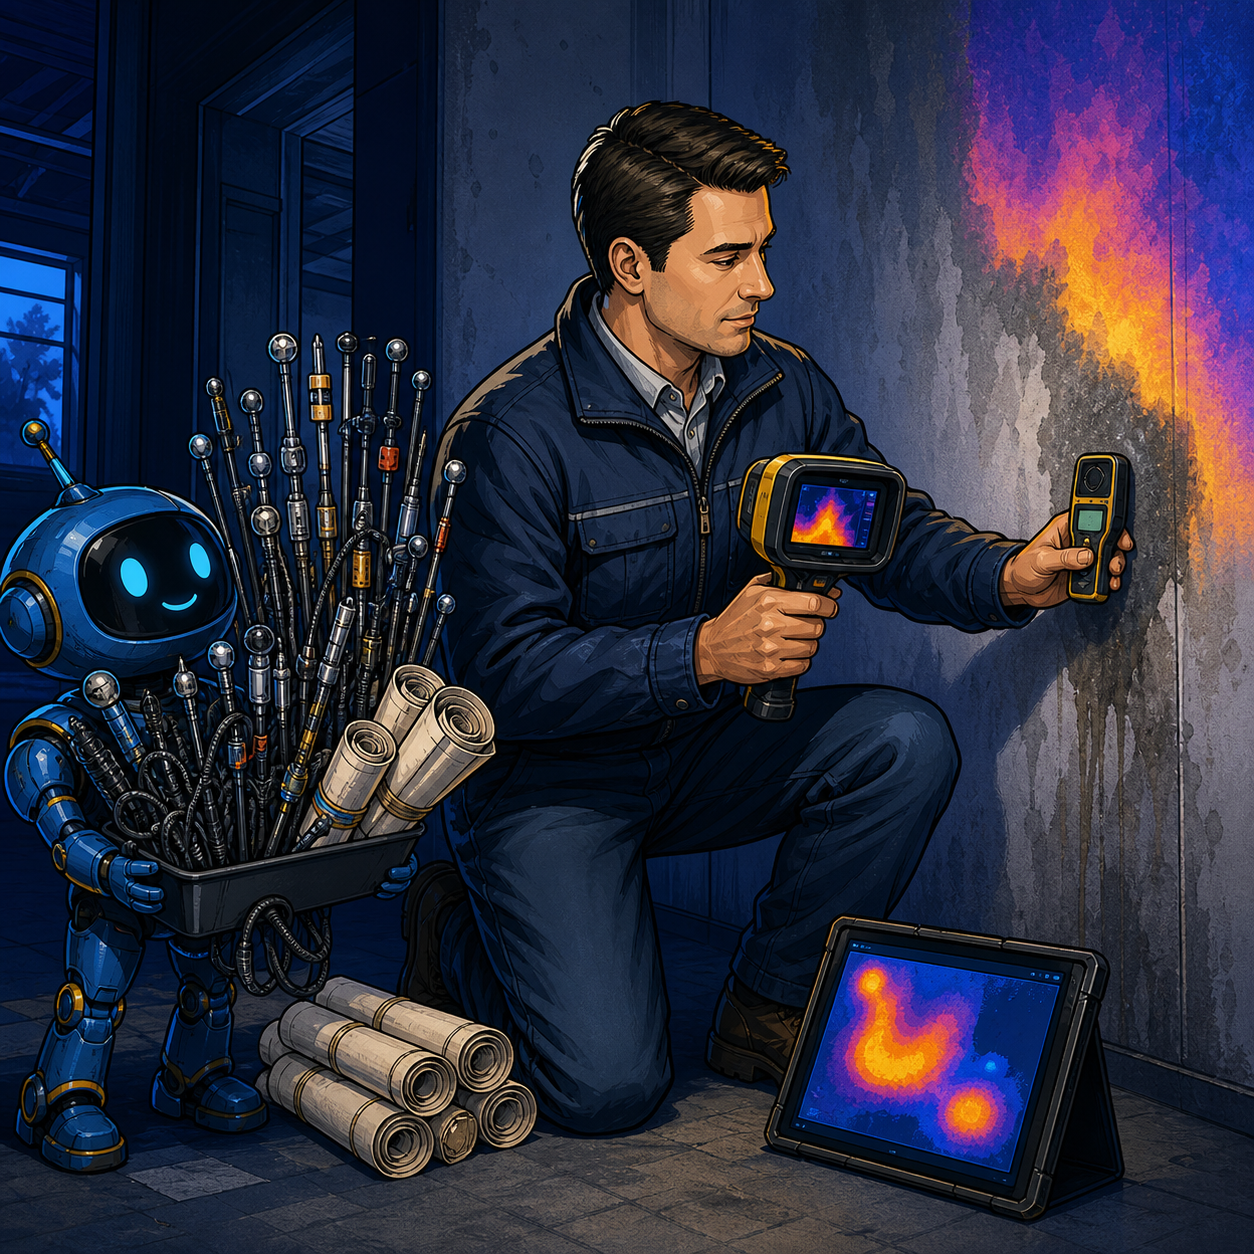
The case: automating interpretation, not the inspection
Denmark's Institut for Fugtteknik is a microbusiness with fewer than ten employees. Working with the Alexandra Institute and a Danish European Digital Innovation Hub, it tested a system for diagnosing moisture problems in buildings: thermal and other measurements are processed by algorithms, results are visualized in a 3D/AR building model, and reports are generated automatically.
The official EDIH case page reports 600 building inspections and classification of four moisture types. It also claims an improvement in diagnostic accuracy of more than 80% compared with manual interpretation. The public description does not provide a confusion matrix, the size of a held-out test set, or whether “80%” means percentage points or a relative increase. The number should therefore be treated as a program-reported outcome, not an independently reproduced benchmark.
The practical value of the case is broader than one metric. It demonstrates how a small field-service company can introduce AI into a physical workflow: keep the expert accountable for the diagnosis, standardize data collection, and automate repeatable interpretation and reporting work.
The business problem
Traditional inspection depends on specialist experience, acquisition conditions, and consistent comparison of readings from several instruments. The same cold area in a thermogram may be caused by moisture, a thermal bridge, air movement, surface material, or outside weather. A wrong conclusion can either miss a serious problem or trigger unnecessary opening and repair work.
The economics are particularly difficult for a microbusiness. Each report consumes the time of a senior expert. Scaling only through hiring is slow because a new employee must learn not merely to operate a camera but to interpret combinations of signals.
In this case, algorithms do not replace the inspection. They help to:
- compare thermal measurements with other wall data;
- cluster similar patterns;
- assign an observation to one of four classes;
- visualize the distribution of a problem in a digital building model;
- assemble a consistent draft report.
The expert can spend less time on mechanical processing and more on verifying the cause and recommending action.
Why a thermal camera is not enough
ISO 6781-1:2023 defines infrared procedures for detecting heat, air, and moisture irregularities in buildings. The standard covers equipment, environmental conditions, operator competence, and reporting. A thermogram represents surface-temperature distribution, which is affected by the surface, the environment, and the sensor itself.
ASTM E3216-26 states the limitation more directly: a thermal anomaly can help identify a zone of possible moisture, but direct measurements at representative locations should confirm the actual condition. The Royal Institution of Chartered Surveyors likewise recommends confirming suspected damp with a moisture meter rather than relying on the image alone.
The architecture should therefore ingest an inspection package rather than a visually impressive picture:
- the original radiometric thermogram, not only a JPEG export;
- contact moisture readings at selected points;
- air temperature and relative humidity;
- time, weather, heating state, and indoor/outdoor temperature difference;
- wall material and construction type;
- sensor position, distance, angle, and emissivity settings;
- an expert-confirmed diagnosis and, where available, the later condition of the property.
Without these fields, the model may learn acquisition conditions instead of the cause of the defect.
Turning 600 inspections into a reusable asset
The main investment is not the neural network but the protocol. Every inspection needs stable identifiers for the property, room, surface, and measurement point. Original files should remain immutable, while transformed images and engineered features carry the version of the processing pipeline.
Each example should separate three levels of labeling:
- observation: thermal anomaly, elevated moisture, staining, odor, or surface damage;
- confirmation: moisture-meter reading, opening, laboratory test, or follow-up visit;
- cause: leakage, condensation, rising damp, thermal bridge, or another agreed class.
If an observation and a cause are mixed, the model will confidently name a diagnosis where it has only an indirect signal. Ambiguous cases need an “insufficient evidence” label and a route to additional measurement.
Training and test sets should be split by building, not by individual frame. Adjacent images of the same wall are too similar; placing some in training and some in testing inflates performance. Separate evaluation slices are also needed for new materials, seasons, and construction types.
Architecture for a small field-service company
This use case does not require a large language model as the first component. Anomaly classification and localization can be handled by a compact computer-vision model or a model combining images with tabular features. It can run on a protected workstation or field laptop when floor plans and property imagery cannot be sent to an external service.
A practical workflow is:
- a mobile application guides the inspector through mandatory points and checks field completeness;
- files and readings receive an inspection identifier and are stored in a local repository;
- a quality gate rejects blurred frames, invalid settings, and missing measurements;
- the model marks suspicious regions and returns a class with calibrated confidence;
- rules route low confidence and sensor conflicts to an expert;
- an engineer accepts or changes the conclusion and records the evidence;
- a report generator fills a controlled template with measurements, images, and limitations;
- confirmed corrections return to the dataset only after review.
An LLM can draft a client-friendly explanation, but it must not invent measurements or causes. Values should be inserted from structured fields, and a specialist should approve the text.
Pilot metrics
“Accuracy” alone is too broad. Missing dangerous moisture and ordering an unnecessary visit have different costs. Classes, error costs, and escalation thresholds must be defined before testing.
The minimum scorecard should include:
- recall for each problem type: the share of confirmed cases detected;
- precision of warnings: the share of flagged zones later confirmed;
- the confusion matrix across the four classes;
- the share of “insufficient evidence” outcomes;
- time from site arrival to an approved report;
- the share of reports accepted without changing the diagnosis;
- repeat visits and unnecessary destructive checks;
- performance by season, material, operator, and camera type.
Early deployments should favor recall and route uncertainty to a person rather than hide uncertainty behind a strong average score.
Economics: expert hours and error cost
Return comes from three sources: less interpretation and reporting time, more inspections per specialist, and fewer expensive mistakes. A thermal camera or local workstation is only part of the cost.
A model calculation can be built without making promises. Record monthly inspection volume, average interpretation and reporting time, fully loaded specialist cost, and rework rate. After the pilot, insert the measured time saving and error change. Subtract instrument depreciation, development, storage, quality review, and retraining.
The monthly effect can be expressed as:
`inspections × hours saved × hourly cost + avoided rework − monthly system cost`.
If the system only accelerates report writing but does not increase capacity or reduce mistakes, value may be modest. If the released time lets the lead expert serve more properties or certify partners, the effect is larger.
A 30-day test-before-invest plan
An inexpensive pilot can be limited to one building type and one workflow:
1. Select 80–120 historical inspections with confirmed outcomes and remove personal data.
2. Agree on four operational classes, an uncertainty label, and the cost of each error type.
3. Define one acquisition protocol and mandatory confirmation measurements.
4. Split the sample by property and reserve the latest 20–30 cases for a blind test.
5. Compare the model with two specialists who cannot see each other's answers.
6. Run 10–20 new inspections in parallel with the existing process, without giving the model authority over the final diagnosis.
7. Calculate approved-report time, errors, repeat measurements, and cost per inspection.
Limited deployment is justified when results remain stable across properties and operators, critical misses stay below a predefined threshold, and experts save measurable time. If the gain disappears in winter, on a new material, or with another camera, fix the data and acquisition protocol before increasing model size.
What a manager should take from the case
The Danish example is useful not as a ready-made product but as a sequence of decisions. A microbusiness began with real inspection data, combined domain expertise with a technical partner, tested before making a large investment, and preserved a comprehensible interface and human decision rights.
Local analytics is especially appropriate for building inspection, property operations, field repair, and insurance assessment when plans and images are sensitive or site connectivity is unreliable. Local execution, however, does not replace measurement discipline. The first step is an inspection protocol and a set of confirmed examples; model selection comes later.
The management conclusion is simple: automate signal comparison and report drafting, not engineering accountability. Vnutrik may bring twenty moisture meters, but a person still signs the causal diagnosis.