Not every automation gain requires a neural network
Small manufacturers often approach AI with a real operational problem: a machine sits idle during changeover, quality depends on an experienced setup specialist, and parameters remain in a notebook or in one employee’s memory. It is tempting to start with predictive AI or an agent. The case of Bulgarian micro-enterprise K I TECH shows a more practical first step: digitise the measurement and close a controllable loop.
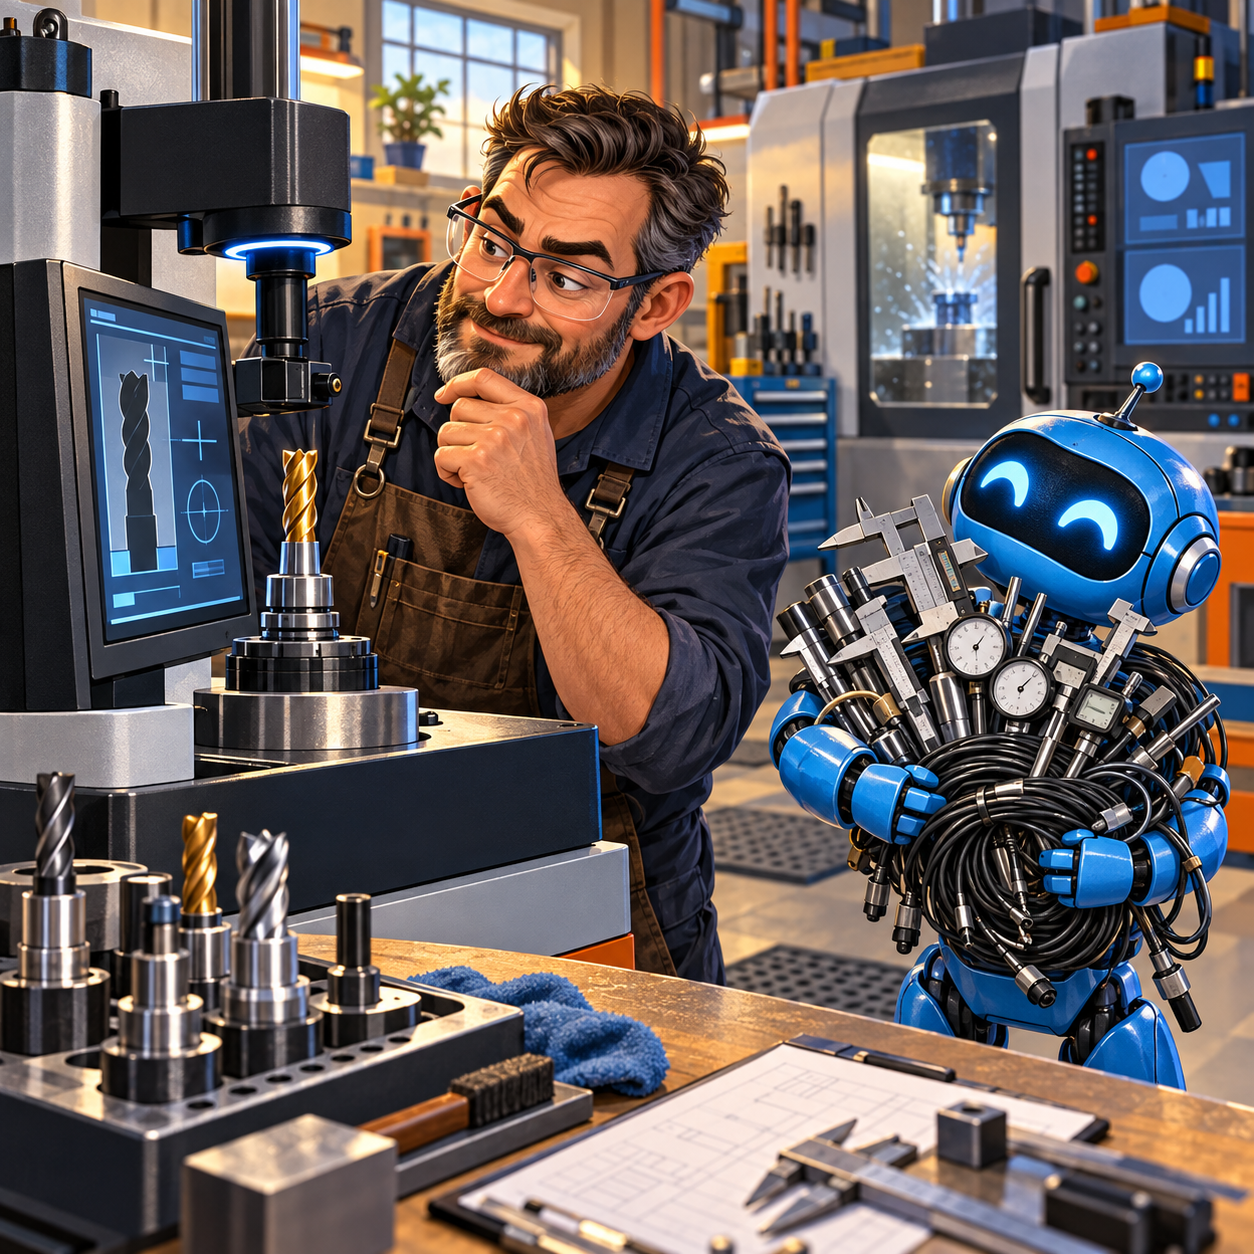
Working with EDIH Zagore and technology partners, the company built a prototype digital tool presetter for preparing and calibrating cutting tools. The published system combines automated parameter control, real-time monitoring, data logging and an operator interface. According to the case report, setup time fell by 30–40% compared with the manual process.
This is not a story about generative AI replacing a machinist. The measurable result appeared after a manual operation acquired sensors, fixed parameters, an event log and a repeatable algorithm. That foundation is what later makes local analytics and AI safe and useful.
What the primary source confirms
K I TECH is described as a micro-enterprise with one to nine employees. Its problem was manual tool preparation: the work took time, depended on the skill of an individual operator and did not systematically preserve parameters for later analysis.
The prototype combined four hardware and software modules:
- automated control of setup parameters;
- real-time process monitoring;
- operational data collection and analytics;
- operator interface and visualisation.
The source reports a 30–40% reduction in setup time, complete calibration repeatability within the tested prototype and less exposure to manual error. The company’s digital-maturity score in the project rose from 34% to 39%. Software development was contributed in kind by partners, so the company’s direct software cost within the project is reported as zero.
Those figures need context. This is a programme participant’s case report, not an independent audit of long-term serial operation. “100% repeatability” refers to the tested prototype, while a one-to-two-year payback is presented as an expectation tied partly to future licensing or sales. A different plant must validate the result again.
Why this matters to AI projects
AI cannot repair a process where no one knows which tool was installed, which target dimensions applied or who changed an offset. Without this context, a model sees a stream of numbers but cannot distinguish a normal changeover from drift, a measurement error from wear, or scheduled downtime from failure.
A digital presetter creates three assets that advanced analytics needs:
1. **A unit of observation.** Every measurement is linked to a specific tool, job and setup version.
2. **A reference.** There is a target value, tolerance and confirmed calibration result.
3. **Feedback.** Preparation parameters can be compared with machine behaviour, part quality and later tool wear.
For a small manufacturer, the right question is therefore often not “which model should we deploy?” but “which process events can we link with evidence?”
Local architecture
A basic system can be separated into five layers.
The first layer is measurement equipment and control. The presetter captures tool geometry, compares it with the job target and produces a calibration result. Critical tolerance logic should remain deterministic and continue to function even when an analytics server is unavailable.
The second layer is a data adapter. It translates equipment-specific signals into a stable schema. For a mixed machine fleet, open models such as MTConnect or OPC UA for Machine Tools are worth evaluating: they provide shared semantics for equipment state, tools, events and results. The choice depends on supported interfaces, but an unversioned proprietary format quickly becomes another dependency.
The third layer is a local event store. Each cycle should record the tool, machine and job identifiers, target dimensions, measured values, deviations, applied corrections, timestamps, operator, calibration version and sensor state. Changes are better stored as new events rather than overwriting history.
The fourth layer is the working interface. The operator sees the tolerance, stop reason and proposed action. Management sees setup duration, repeat measurements, downtime and deviation distributions. Production control and experimental predictions should not be mixed on one screen.
The fifth layer integrates with MES, CMMS or an accounting system. A measurement gains business meaning when it is linked to an operation, batch and subsequent production quality.
Where local AI fits
Once a reliable history exists, models can be introduced one task at a time.
- Anomalies in measurement sequences may indicate contamination, loose fixtures or sensor drift.
- Remaining tool life can be estimated from measurements, load and machining results.
- A model can predict changeover time for scheduling.
- A local assistant can explain event logs and retrieve similar cases from manuals without receiving permission to change offsets.
For the first three tasks, time-series data and correct features matter more than a large language model. An LLM can be useful as an interface to documents and logs, but it should not be the only machine-control layer.
All predictions should initially run in shadow mode. The model writes a recommendation beside the operator’s actual decision, and the team compares outcomes. Permission to change parameters should remain with a deterministic service that uses allow-listed operations, bounded ranges and explicit confirmation.
Data and quality control
A minimum record for one setup cycle includes:
- `tool_id`, tool type and serial number;
- `machine_id`, job, material and operation;
- target dimensions and tolerances;
- initial and final measurements;
- corrections and their author;
- duration of each stage;
- result code and reason for repeated setup;
- firmware, adapter and rule versions;
- later part-quality outcome.
The team must separately monitor missing events, duplicates, clock drift and unit changes. If a sensor starts reporting millimetres instead of micrometres after maintenance, the model should not be the first component to discover that on a bad part.
Access to logs and access to commands must be separated. Analytics may read broader data than the control service, but it should not inherit write privileges. Every action should preserve the user, reason, old and new value, and operator confirmation.
How to model the economics
The main KPI is not model accuracy but released machine time without reduced quality. A simplified monthly-benefit formula is:
`setups per day × minutes saved × working days × machine-hour cost`.
The following is a modelled example, not a K I TECH result. With 12 setups per day, eight minutes saved, 22 working days and a fully loaded machine-hour cost of RUB 3,000, the plant releases 35.2 hours, or about RUB 105,600 per month. Maintenance, recalibration, integration and operator exception time must be deducted.
Lower scrap, fewer emergency stops and faster job preparation can be counted separately. However, those benefits should not be added without evidence: released minutes have financial value only when the machine actually produces more output or avoids overtime.
A pilot without an expensive rebuild
The pilot can be limited to one tool type and one machine. For two weeks, establish the manual baseline: median and p95 setup time, repeat measurements, errors and downtime. Then operate the digital loop in parallel for another two to four weeks.
Acceptance criteria should be agreed in advance:
- reduction in median and p95 setup time;
- no deterioration in tolerance or part quality;
- share of cycles without manual data correction;
- number of repeated calibrations;
- system availability and recovery time;
- savings per confirmed cycle.
Only then should the team decide whether the next AI layer is justified. If deterministic automation has already removed the main loss, connecting a second machine may be a better investment than training a model.
What a small manufacturer can repeat
The K I TECH case is valuable not because of one specific presetter but because of its sequence: prototype, measurable parameters, event logging, integration testing and only then scale. Partner contributions reduced the initial risk, but responsibility for the company’s own economics remained with the business.
Start by mapping one changeover: who makes each decision, which data they use, where waiting occurs and how the result is confirmed. Digitise that route and establish baseline metrics. Once a trustworthy history exists, it becomes clear where a local model adds value and where an ordinary rule is cheaper and more reliable.