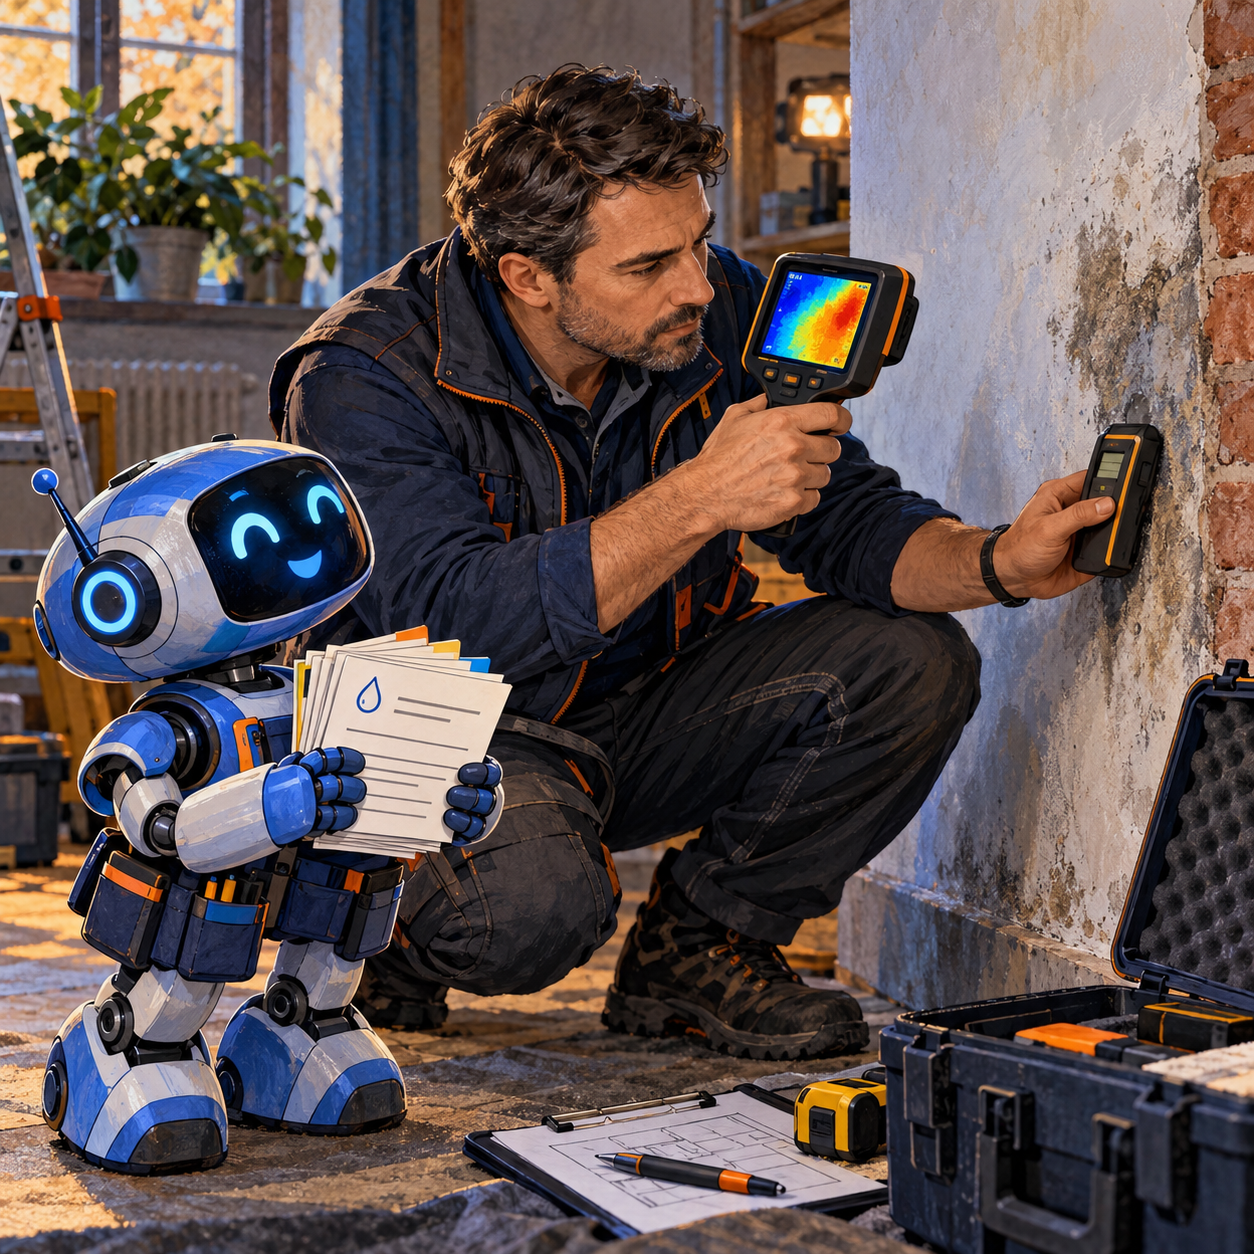
A damp patch is not a finished diagnosis
For a small building-inspection company, a damp patch presents more than a technical question. The team must find the source, explain the reasoning to the client and avoid recommending an expensive repair to the wrong part of the building. One photograph is insufficient: similar appearances can result from different conditions. When every specialist measures and describes an object differently, knowledge stays in individual notebooks, making it hard to repeat an inspection or audit a conclusion.
Denmark's microbusiness Institut for Fugtteknik and the Alexandra Institute described a system on the European Digital Innovation Hubs platform that combines wall measurements, thermal data, classification algorithms and a digital building representation. The case was published on 9 January 2026. It is useful not as a promise that a neural network can “see through concrete,” but as a narrow professional workflow where AI depends on physical measurements and expert work.
The evidence needs a clear boundary. The project page reports four moisture classes, 600 building inspections and an improvement in diagnostic accuracy of “more than 80%” against manual interpretation. It does not define the metric, starting accuracy, sample split or independent validation protocol. The figure therefore cannot forecast results for another contractor. We treat it as a project claim and base the management lesson on the documented workflow and the limits of the method.
What the Danish project did
According to the EDIH case, the team combined analysis of thermal data and wall measurements with machine-learning algorithms. The system is intended to classify four types of moisture; the public account does not disclose their definitions or decision criteria. A 3D or AR representation helps show the distribution of moisture and communicate findings to less experienced professionals and clients. Reporting is more automated than an entirely manual process. The described result is diagnostic support, not permission to open a wall without engineering verification.
The company's own website adds details of the field workflow. Specialists study building and drainage plans, inspect foundations, façades, roofs and technical installations, measure air humidity and assess ventilation. The company says it may take small material samples and issues a written report with a likely cause and recommended response after the inspection. This helps locate AI's boundary: the algorithm is one part of the survey, not a replacement for the whole survey.
The case does not say that a language model or RAG is the core of its system. The principal AI here is measurement analysis and classification. A generative model could draft a client-friendly report, but that is a possible separate adaptation, not a documented component of this Danish implementation. Substituting one kind of AI for another just to use a fashionable label would be poor engineering.
Why a thermal image cannot show the cause directly
A thermal camera displays differences in surface temperature. Moisture can change the thermal pattern through evaporation and other physical effects, but similar temperature anomalies can have different causes. A technical bulletin from the US National Institutes of Health explicitly describes thermal imaging as a way to identify areas for further investigation, not final proof of a water source. Contact moisture meters also have limitations and must be interpreted for the material and measurement location.
An independent experimental study in Sensors in 2022 compared infrared thermography with a surface moisture meter and a gravimetric method on two wall specimens. The authors found that the temperature gradient associated with high moisture differs substantially with surrounding conditions. That is not an evaluation of the Danish system. It explains why applying a threshold from one wall and climate to another without verification can be unsafe.
A practical workflow should therefore distinguish three levels of conclusion:
- “There is a thermal anomaly” is an observation from an instrument.
- “Moisture is likely” is a hypothesis after comparison with other readings and conditions.
- “The cause is established and this repair is needed” is a responsible specialist's conclusion based on the full evidence.
AI may speed up the first two levels. Jumping directly to the third creates false confidence: the report looks neat while water continues to enter from another part of the building.
Data and architecture for a small contractor
A pilot needs reproducible inspection records, not thousands of random photos of “damp walls.” The minimum dataset includes construction and material type, measurement place and time, ambient temperature and humidity, heating and ventilation conditions, the thermal frame and camera settings, readings at reference points, ordinary photographs, and the history of leaks and repairs. Where a cause has been verified, record it separately from the initial hypothesis. Otherwise the model will learn to repeat the first engineer's opinion rather than identify the fault.
Labels should follow confirmation of the outcome: opening a structure, observing it after a repair, or another method accepted by the firm. Not every property will yield a final answer; an “undetermined” category is better than invented certainty. Split data by inspection and, if possible, by building and season. Randomly placing nearly identical frames of the same wall in training and test sets produces attractive but useless accuracy.
The operating system can be straightforward. A technician's application captures measurements and images; protected storage ties them to the site and protocol version; a classifier proposes likely categories and uncertainty; an engineer sees the original readings, corrects the proposal and signs the report. Geometric visualization is warranted only if it helps locate a problem in a complex building. For a single room, an elaborate AR scene may cost more than it saves.
Local inference makes sense where inspections occur with poor connectivity or clients provide confidential plans and property records. A small classifier could then run on a workstation or field device, with records synchronized through an approved channel. This is a design option for a Russian contractor, not a claim about where the Danish system ran. RAG is not required; it might be added to search internal methods and past reports with version control, but it cannot replace a physical reading.
Quality checks and business economics
Evaluate a pilot on decisions that affect the job. The share of correctly classified cases matters, but is not enough. Also count missed serious cases, false alarms, cases where the system properly abstains, inspection and reporting time, repeat visits and disagreement between specialists. Break results down by material and capture conditions; an overall average can hide a weak segment.
Here is an illustrative calculation, not a result from Institut for Fugtteknik. Assume 40 inspections each month and a 20-minute reduction in report preparation with unchanged quality. That is roughly 13 staff hours monthly before time spent checking drafts. Compare those hours with the cost of instruments, labeling confirmed cases, development, storage, model maintenance and repeat checks. Faster reports alone may not pay for a complex system. Avoided incorrect repair decisions could be more valuable, but that effect needs separate, careful measurement.
A sensible first step for a construction or property-maintenance firm is to review 30–50 past inspections and agree on a single measurement protocol. Mark cases with a confirmed cause separately from those where diagnosis remained a hypothesis. Next run a shadow test: the system suggests a class, engineers work as usual, and their decisions are compared after confirmation. Only then enable automatic report drafts. If the data are sparse or causes are seldom verified, a digital measurement log and follow-up tracking will be more useful initially than training a proprietary model.
The management takeaway
The case illustrates a sound implementation order: physical measurement, shared data structure, testable hypothesis, human conclusion and only then text automation. The public project card claims a large accuracy gain but does not disclose enough detail to use that number in an investment model. For a small business, AI is valuable here as a diagnostic assistant: it helps relate measurements and document a decision. Responsibility for the cause of dampness and the proposed repair remains with the specialist.