Why a business needs to see the path of one answer
When an AI agent takes 40 seconds to answer a customer, saying “the model is slow” explains very little. During that time the system may have searched documents, called the model several times, retried a failed tool, waited for the CRM, or checked permission for an action. If all of this is represented by one line — “request started, answer completed” — a manager sees the complaint and the token bill but not the cause.
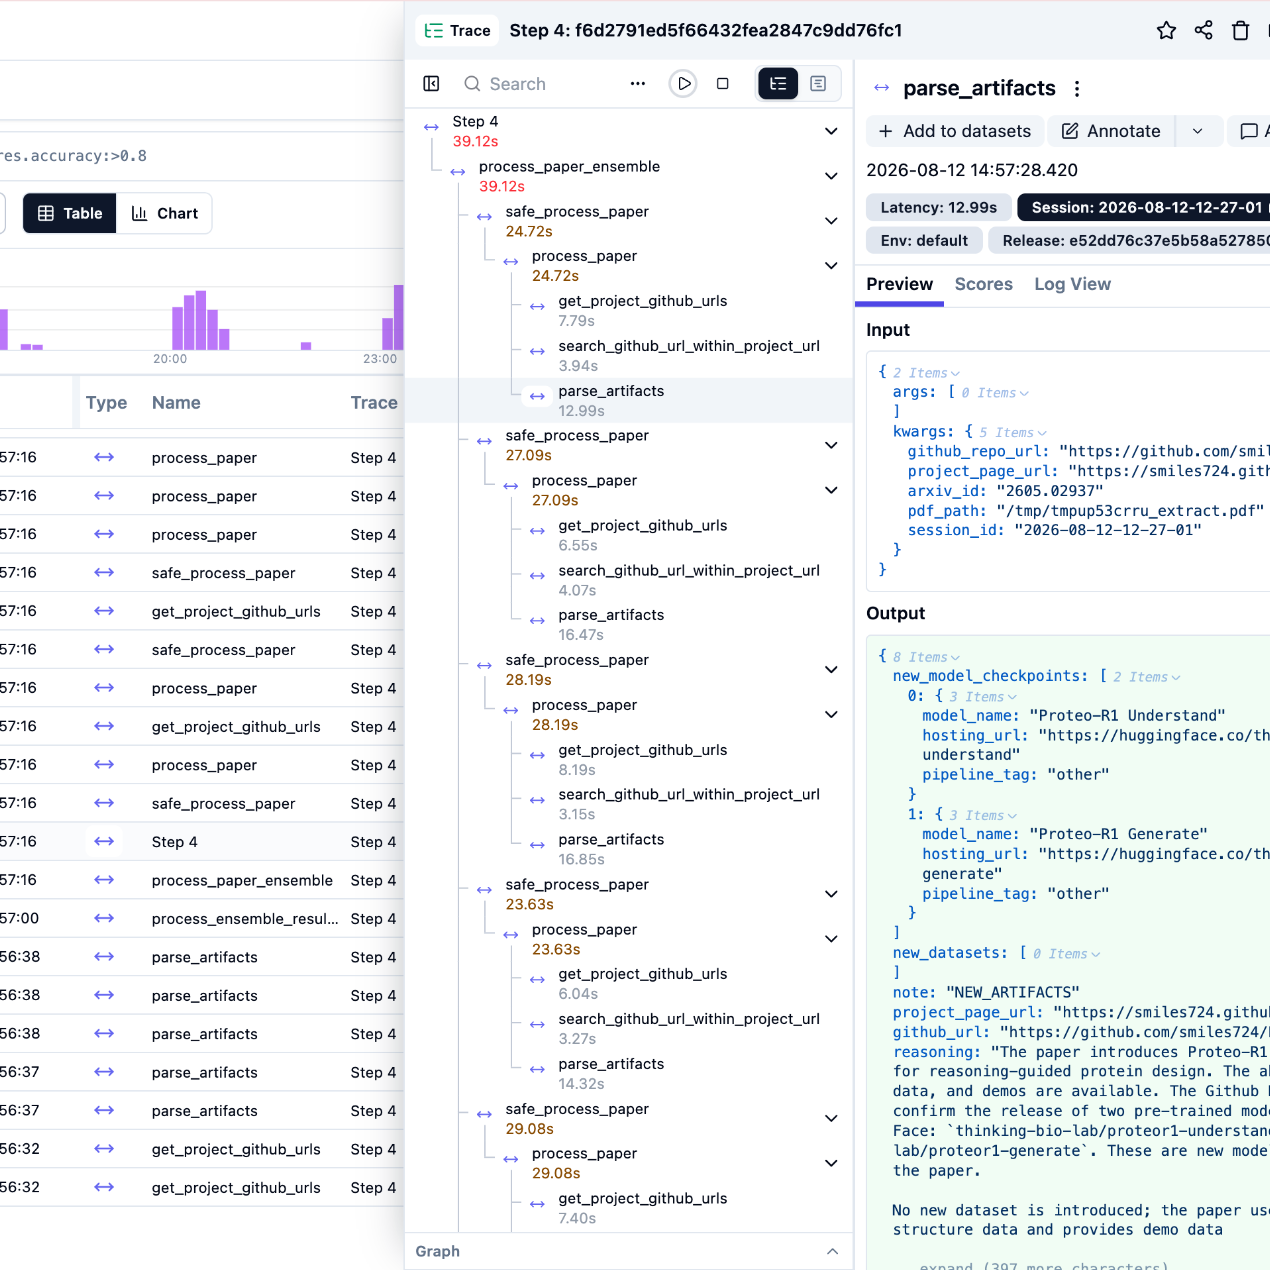
Langfuse's guide to well-structured traces proposes one trace for a self-contained unit of work, such as one chatbot turn or one agent run. Model and tool calls should remain distinguishable inside it. Its official interface screenshot shows a tree of steps with different durations. This is a tooling example, not a measurement of a typical Russian business. The useful pattern is to measure one request's complete journey through the model, retrieval, and integrations rather than only the LLM's average response time.
Tracing does not improve answer quality by itself. It reveals where seconds and money are spent and whether a successful final answer conceals retries or errors. This matters particularly to a small company: each unnecessary agent loop can raise customer wait time, token consumption, and the workload of the employee checking the final output.
What to record in a trace
A trace is the history of one user request. It contains nested units of work, called spans: intake, access check, retrieval, model call, tool call, result validation, and human approval. A shared `trace_id` connects them without trying to join unrelated logs by timestamp and customer name.
A practical minimum for each stage includes:
- operation name and duration;
- result code and error type, without request content;
- workflow, model, and tool version;
- input and output token counts where available;
- retry count and human handoff flag;
- a de-identified process or order reference for internal reconciliation.
Langfuse recommends showing each model invocation as its own `generation` and a tool call as a `tool` alongside the generation that requested it. This prevents repeated calls and context consumption from disappearing inside one agent-loop record. Step names should be stable and describe an action, such as `retrieve-context`: putting a changing order number into a name breaks grouping. Add your own business outcome: answer accepted without edits, corrected by a worker, rejected, or handled manually. Without this, “fast” is easily mistaken for “useful.”
For a sales assistant, a trace might look like this: an enquiry arrives through a form; the agent retrieves the current price list and delivery terms; the model drafts an offer; deterministic code checks price and mandatory fields; a manager approves sending. If price-list retrieval takes 12 seconds and the model takes three, changing the model will not fix the main delay. If the CRM call repeats three times, the cause may be a timeout rather than an “unintelligent” AI system.
Architecture without a new platform just for a chart
For a pilot, instrument the one service that starts the business process and export traces over OTLP to an observability backend the company already has. If there is no such backend, a local viewer can serve a short trial; it is not automatically a production-grade store. OpenTelemetry documentation describes the Collector as an intermediate component that receives, processes, and forwards telemetry to a selected backend. Access rights, retention, and network placement remain company decisions.
Create the root span when the enquiry arrives. Propagate its context through retrieval, the local model server, and CRM adapters so each child operation belongs to the same trace. For actions with consequences — sending an email, changing a price, or writing to ERP — record a separate stage and the approval outcome, but keep the tool behind an authorization gateway. Observability is not a security control: a trace may show an unauthorized attempt but will not necessarily stop it.
A local model is appropriate when data, policy, or workload justify an in-house boundary. Traces can remain within that network too. If the company makes only an occasional single model call with no tools, full distributed tracing may be excessive: begin with response time, error count, and cost per accepted outcome. RAG is useful when an answer depends on changing documents; tracing is useful for seeing the latency and quality of each RAG step. They solve different problems.
Avoid making monitoring a second copy of confidential data
The main risk is enabling full request-text capture “for debugging.” The Langfuse guide recommends meaningful step inputs and outputs for later analysis, but that does not oblige a company to record production secrets in every trace. OWASP classifies personal, financial, health, and confidential business information as sensitive. If these data enter traces, the company has created another store with access rights, deletion rules, and exposure risk. For sensitive workflows, design masking before export and verify it with a test marker.
For normal operation, retain metadata and technical codes. Secrets, phone numbers, addresses, contract excerpts, and retrieved document text should not appear in span names or free-form attributes. For a difficult incident, a detailed mode can be enabled temporarily on test or de-identified data with separate approval and short retention. One straightforward check is to send a test request containing a unique marker and verify that it appears neither in exports, nor in the viewer, nor in a telemetry backup.
Do not put customer identifiers into metric names either: a large set of unique values inflates storage and makes analysis harder. Process category, workflow version, and technical trace ID are enough. Access to detailed traces should be narrower than access to aggregate latency charts.
Measure value, not attractive dashboards
Before a pilot, choose one process and gather at least a week's baseline: median and p95 time from enquiry to approved answer, fraction needing human correction, retry count, token consumption, and cost per accepted result. Then add five to seven spans and test whether they expose an avoidable bottleneck. Merely collecting traces creates no savings.
An illustrative calculation: 2,000 enquiries a month, 10% with one unnecessary retry costing a hypothetical RUB 3. Removing those retries frees RUB 600 in direct variable cost. If it also saves two minutes of employee work in 200 cases, that is another 6.7 hours; at a modeled fully loaded labor cost of RUB 1,200 per hour, the capacity effect is roughly RUB 8,000. Whether that capacity turns into money depends on actual workload and redeployment. None of these figures comes from the Langfuse demo.
Keeping 100% of detailed traces costs money too. Full collection can be sensible during a brief low-volume pilot, followed by retention, volume limits, and sampling. OpenTelemetry distinguishes sampling at the start of a request from sampling after a trace has completed; the latter can retain slow or failed cases but needs more memory and operational care. Do not add sophisticated tail sampling until volume is demonstrably a problem. If a rare error is critical, ensure your sampling policy does not discard it.
A ten-working-day pilot
In the first two days, take one workflow such as answering an enquiry about product availability. Describe its stages and assign an owner to each consequential action. Over the next three days, instrument only stage boundaries and verify that `trace_id` propagates through the model and two key tools. Separately test that no secrets enter telemetry.
Then gather real traces under restricted access and inspect the ten slowest and ten failed attempts. Classify the cause: model, retrieval, external system, retry, or approval wait. Fix one testable cause and compare p95, accepted-answer rate, and human time with the baseline. A faster workflow with more errors or edits is not a success.
For a business, the point of tracing is simple: it changes the argument from “which model is slow?” to the testable question “which stage prevents us from closing the enquiry?” Decide whether to expand by accepted outcomes and process cost. The cover is a square crop of an official Langfuse documentation screenshot in its MIT-licensed repository; the interface is an example, not a required product choice.